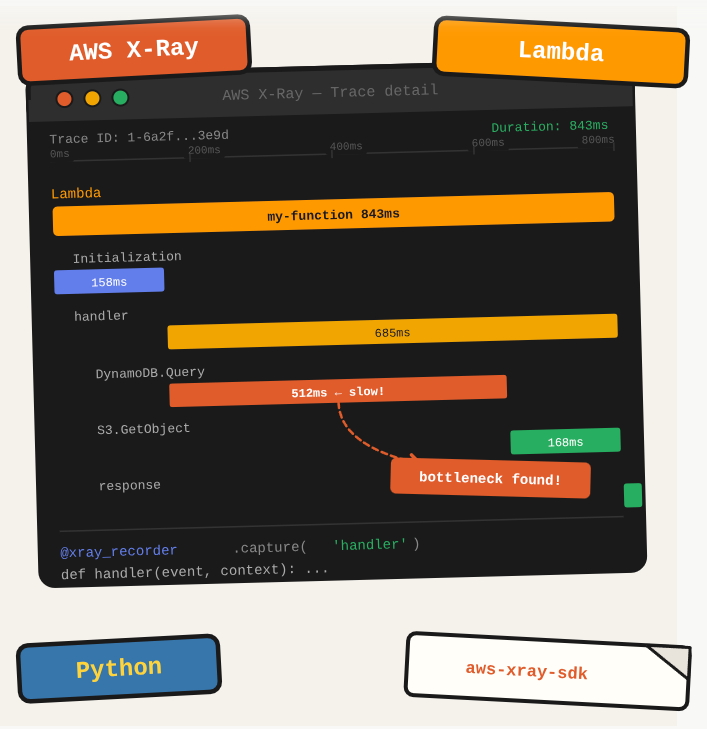
Your Lambda function is slow and you have no idea which part is causing it. X-Ray traces each invocation, shows you service map connections, and breaks down where time is being spent. It is the difference between guessing and knowing.
TL;DR: Add AWS X-Ray tracing to a Python Lambda function to get distributed traces and performance insights.
Stack: AWS Lambda, AWS X-Ray, Python, aws-xray-sdk
Level: Intermediate
Reading time: ~5 min
Install dependencies
pip install botocore boto3 aws-xray-sdkInstrument your Lambda
from aws_xray_sdk.core import xray_recorder
from aws_xray_sdk.core import patch_all

patch_all()  # Auto-instruments boto3, requests, and other supported libraries

def lambda_handler(event, context):
    # Your Lambda code here
    pass
The patch_all() call intercepts boto3 calls, HTTP requests, and other supported libraries automatically, so each downstream call becomes a subsegment in your trace without any extra code.
Enable X-Ray on the Lambda
In the Lambda console, go to Configuration, then “Monitoring and operations tools”, and enable “Active tracing.” This is the switch that tells Lambda to attach an X-Ray trace to each invocation.
What you’ve built
X-Ray tracing enabled on your Lambda and instrumented with the Python SDK. Traces will now appear in the X-Ray console showing service maps, latency breakdowns, and subsegment timing for each invocation.
Next steps
- Create custom subsegments with xray_recorder.begin_subsegment(“db-query”) to trace individual database calls within your Lambda.
- Enable X-Ray on your API Gateway stage to get end-to-end traces from the HTTP request through Lambda into downstream services.
- Set up X-Ray sampling rules to reduce trace volume and cost in high-traffic environments while keeping full traces for error cases.
Questions or feedback? Find me on LinkedIn or GitHub.